It all started when…
Few weeks ago we have decided to create a dashboard where we can monitor the status of the SUSE Linux Enterprise maintenance update queue. Naturally there are tons of cool open source solutions to build this type of monitoring. Two decades ago I probably would have written a Perl or Python based monitoring script for the monitoring part and use the good old gnuplot (http://www.gnuplot.info/) to visualize the data and create an active page written in some silly web UI framework. Let’s just say that luckily those times has passed.
I have turned to the development team of the openQA and asked them what do they use for their monitoring system. It is a really good open source practice to use the technology what our friends are using so we can ask for help and we can later contribute to their projects.
I have learned that the openQA monitor is based on the Grafana - InfluxDB - Telegraf chain. At first it seemed a bit too complex, but looking closer how this pipleline works I started to like it. After we were ready with the dashboard I decided to write up the key steps and most important learning so I will not forget it so easily and I can share with anybody who may need to create similar tool.
First let’s walk through the main components
- Grafana is a multi-platform open source analytics and interactive visualization web application. It provides charts, graphs, and alerts for the web when connected to supported data sources.
- InfluxDB is an open-source time series database developed by the company InfluxData. It is written in the Go programming language for storage and retrieval of time series data in fields such as operations monitoring, application metrics, Internet of Things sensor data, and real-time analytics.
- Telegraf is an open source plugin-driven server agent for collecting and reporting metrics.
The installation step on openSUSE TumbleWeed were the following
sudo zypper install grafana
The official installation instructions are pretty clear and straight forward.
There is not much hack around, most of the steps are really next-next-finish. Most of the time with this step I have wasted on configuring my haproxy and creating certificates for my own grafana service.
To start the Grafana service and verify that the service has started I needed these steps
sudo systemctl daemon-reload
sudo systemctl start grafana-server
sudo systemctl status grafana-server
And I have configured the Grafana server to start at boot:
sudo systemctl enable grafana-server
I have opened the Web UI of the Grafana and logged in login with the default admin:admin credentials. Naturally I have changed the password to a strong one.
In the Grafana web UI I went to the “Add data source” and selected InfluxDB. The configuration there is pretty obvious. Setting the user credentials for the database is essential. But the UI has a “test” feature, so it is basically impossible to set up the database wrong.
During this step I had to install and set up the InfluxDB. That was yet again so easy that I was sure I am doing something wrong.
zypper install influxdb
systemctl start influxdb
systemctl status influxdb
systemctl enable grafana-server
At this point I refused to be the victim of the “everything must be configured with a web UI movement” so I have not even touched the InfluxDB web UI. Most likely this part is necessary if somebody wants to use InfluxDB for a more complex use case. But I knew that I all need is feeding the database with simple records in time series.
In the /etc/influxdb/config.toml I have changed the value of auth-enabled from false to true and remove the leading # symbol from the line to uncomment the setting as shown below.
...
[http]
  ...
  # Determines whether user authentication is enabled over HTTP/HTTPS.
  auth-enabled = true
...
Save and close the file. Next, restart the influxdb service to load the new security setting.
sudo systemctl restart influxdb
After that I could log in to the InfluxDB server with the admin username and password that you created above by executing the following command.
$ influx -username 'admin' -password '***'
I am not sure if was necessary but I have created the telegraf database.
influx -username 'admin' -password '***'
  CREATE DATABASE "telegraf" WITH DURATION 17280h
I have heard opinions that on the first telegraf push the database server would have created the table automagically. That I can not confirm, but at last I know that creating manually the database is not harmful.
The next and almost final step is to install and configure the Telegraf service
zypper install telegraf
Then I configured it by editing the /etc/telegraf/telegraf.conf
[global_tags]
[[outputs.influxdb]]
  urls = ["http://127.0.0.1:8086"]
  database = "telegraf"
  username = "admin"
  password = "***"
  user_agent = "telegraf/osd"
[[inputs.exec]]
  commands = [ '/etc/telegraf/scripts/load.sh' ]
  interval = "10s"
  timeout = "10s"
  data_format = "influx"
The SaLt State files of the openQA’s monitoring system served as template.
The /etc/telegraf/scripts/load.sh is a simple oneliner to return cpu, memory and storage status of the root
#!/bin/bash
echo "load,machine=grafana.localhost  cpu=`LC_ALL=C top -bn1 | grep "Cpu(s)" | sed "s/.*, *\([0-9.]*\)%* id.*/\1/" | awk '{print 100 - $1}'`,memory=`free -m | awk '/Mem:/ { printf("%3.1f", $3/$2*100) }'`,disk=`df -h / | awk '/\// {print $(NF-1)}'|sed 's/\%//g'`"
Then start the telegraf service
systemctl start telegraf
systemctl status telegraf
systemctl enable telegraf
The telegraf configuration can be tested with a single command
telegraf --config telegraf.conf --test
At this point I must note that Telegraf is pretty annoying when it comes to the data format of the inputs.exec plugin. One must be super careful with all the commas, white spaces and data types while Telegraf is not very communicative when it comes to explaining what is wrong with the output of the executed command. Anyhow, I got it right after some attempts, but I am not pleased with that part.
The rest is UI tossing in the Grafana web UI. Creating a new dashboard and adding new panels, setting up the data source and making it look pretty.
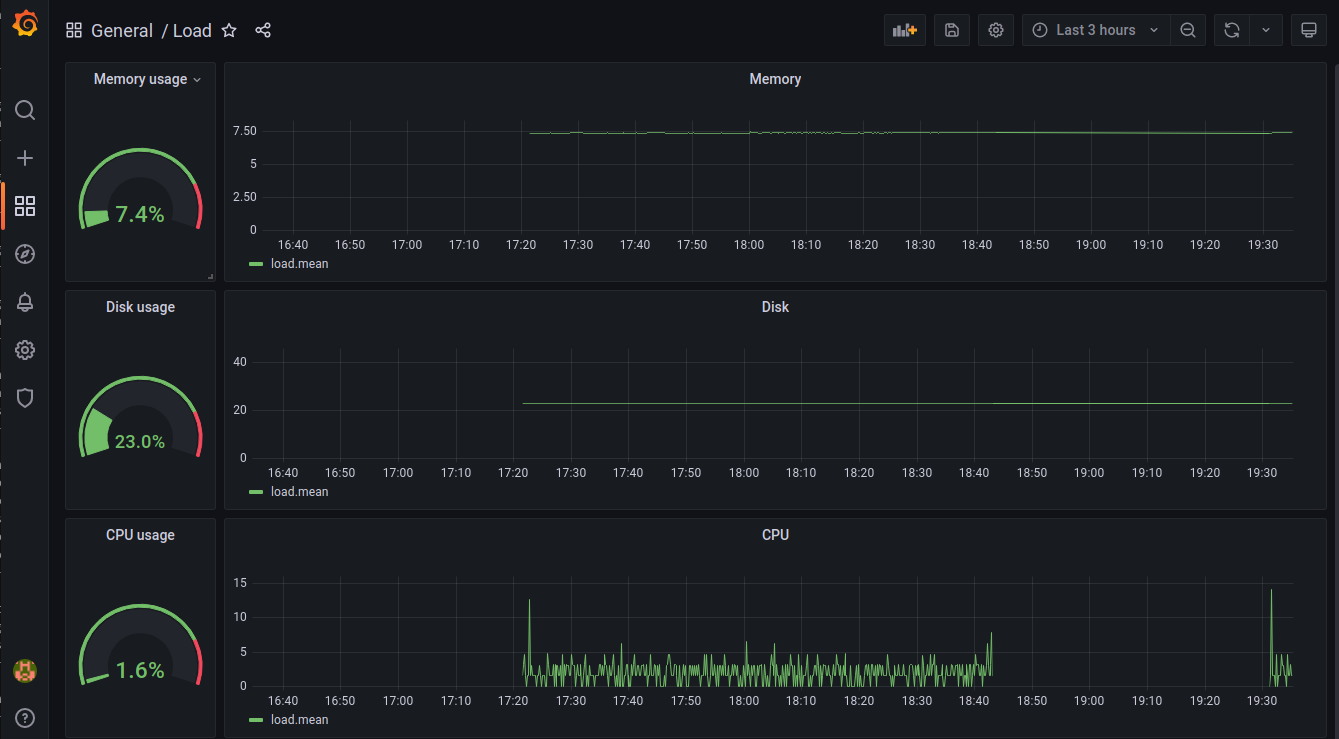
Really easy. My overall view is that setting up this toolchain is pretty simple, well documented and easy to use. If I need to set up monitoring smart devices, sensors or server statuses I will definitely will use Grafana and Telegraf.